Atmospheric river
atmospheric river[edit | edit source]
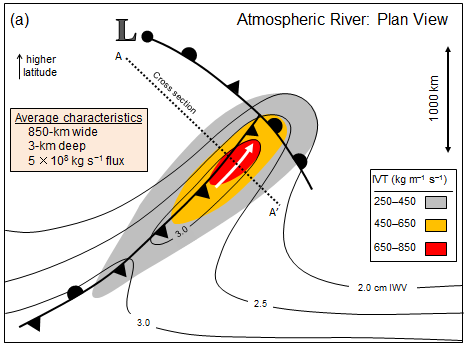
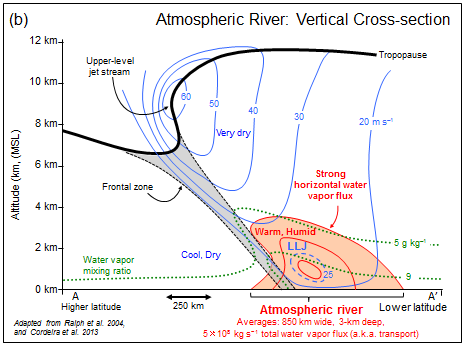
Fig. 1. Schematic summary of the structure and strength of an atmospheric river based on dropsonde measurements deployed from research aircraft across many atmospheric rivers and on corresponding reanalyses that provide the plan-view context. Magnitudes of variables represent an average midlatitude atmospheric river. Average width is based on atmospheric river boundaries defined by vertically integrated water vapor transport (IVT; from surface to 300 hPa) lateral boundary threshold of 250 kg m−1 s−1. Depth corresponds to the altitude below which 75% of IVT occurs. The total water vapor transport (a.k.a. flux) corresponds to the transport along an atmospheric river, bounded laterally by the positions of IVT = 250 kg m−1 s−1 and vertically by the surface and 300 hPa. (a) Plan view including parent low pressure system and associated cold, warm, and warm-occluded surface fronts. IVT is shown by color fill (magnitude; kg m−1 s−1) and direction in the core (white arrow). Vertically integrated water vapor (IWV; cm) is contoured. A representative length scale is shown. The position of the cross section shown in (b) is denoted by the dashed line A–A′. (b) Vertical cross-section perspective, including the core of the water vapor transport in the atmospheric river (orange contours and color fill) and the pre-cold-frontal low-level jet (LLJ), in the context of the jet-front system and tropopause. Water vapor mixing ratio (green dotted lines; g kg−1) and cross-section-normal isotachs (blue contours; m s−1) are shown. [Schematic prepared by F. M. Ralph, J. M. Cordeira, and P. J. Neiman and adapted from Ralph et al. (2004), Cordeira et al. (2013), and others.]
Cordeira, J. M., F. M. Ralph, and B. J. Moore, 2013: The development and evolution of two atmospheric rivers in proximity to western North Pacific tropical cyclones in October 2010. Mon. Wea. Rev., 141, 4234–4255, doi:10.1175/MWR-D-13-00019.1.
Guan, B., and D. E. Waliser, 2015: Detection of atmospheric rivers: Evaluation and application of an algorithm for global studies. J. Geophys. Res. Atmos., 120, 12 514–12 535, doi:10.1002/2015JD024257.
Neiman, P. J., F. M. Ralph, G. A. Wick, J. D. Lundquist, and M. D. Dettinger, 2008: Meteorological characteristics and overland precipitation impacts of atmospheric rivers affecting the West Coast of North America based on eight years of SSM/I satellite observations. J. Hydrometeor., 9, 22–47, doi:10.1175/2007JHM855.1.
Ralph, F. M., P. J. Neiman, and G. A. Wick, 2004: Satellite and CALJET aircraft observations of atmospheric rivers over the eastern North Pacific Ocean during the winter of 1997/98. Mon. Wea. Rev., 132, 1721–1745, doi:10.1175/1520-0493(2004)132<1721:SACAOO>2.0.CO;2.
Zhu, Y., and R. E. Newell, 1998: A proposed algorithm for moisture fluxes from atmospheric rivers. Mon. Wea. Rev., 126, 725–735, doi:10.1175/1520-0493(1998)126<0725:APAFMF>2.0.CO;2.
Term edited 4 May 2017.


